Income offers a broader measure of family security and prosperity. It includes non-wage forms of income (like rents or capital gains) and it groups individuals into family or household units. Family and household incomes are shaped by both the wage structure (wage and salary compensation make up about two-thirds of national income) and by family or household size and composition.
The broad strokes, the national income trends of our recent history are now quite familiar. In the first 30-odd years (1947-1979) after World War II, income growth was broadly shared — indeed the poorest fifth of households saw greater real income growth than any other cohort. In an era marked by steady growth, decent union density, and robust social policy, a rising tide really did lift all boats.
Figures 1 & 2. Real Income Growth No Longer Broadly Shared
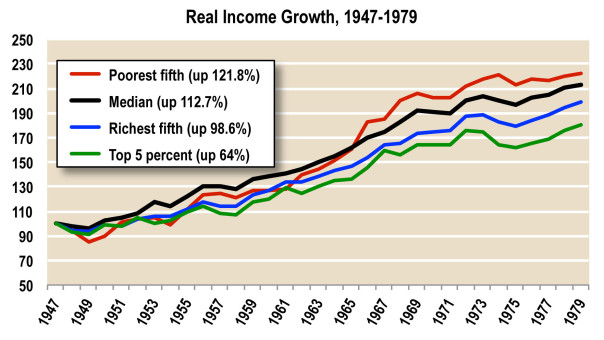
In the 30-odd years since 1979, by contrast, things have taken an ugly turn. The richest 5 percent (up 74.9 percent) and the richest 20 percent (up 48.8 percent) have continued to bob upward with the growth of the economy. But median incomes (up only 8.4 percent) have barely budged, and the poorest fifth — down over 12 percent — are sinking.
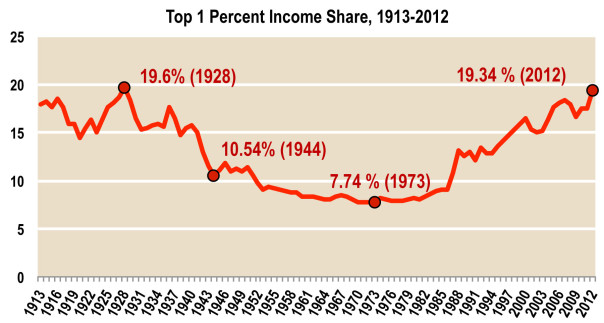
The larger historical context, in turn is suggested by the trajectory of top incomes. These grow modestly from 1947-1979 — but take off dramatically after that. This growth in top incomes has pushed the share claimed by the richest 1 percent to near 20 percent, a threshold last broached at the end of the 1920s — a decade that ended with the crash of 1929 and a political response that included fair labor standards, financial regulation and reform, collective bargaining rights, and progressive taxation. These measures pared the top 1 percent’s share nearly in half by the end of the Second World War, and it continued to fall across the long postwar boom, bottoming out at under 8 percent in the early 1970s. But since then, that script has played out in reverse — each blow to organized labor, each episode of financial deregulation, each tax cut served to pad the 1 percent’s share. In 2012, the richest 1 percent again claimed nearly one-fifth of the nation’s income.
Figure 3. Richest See Highest Share of Incomes Since Before Great Depression
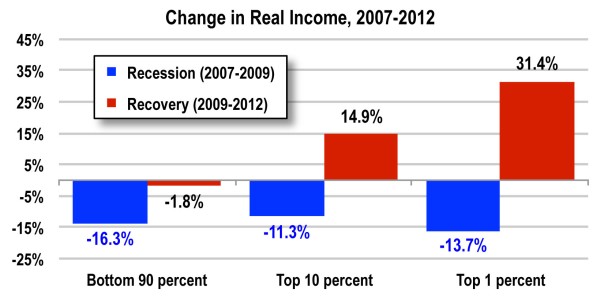
This underlying inequality has been underscored by the pattern of income growth across the last business cycle. During the downturn, incomes slipped across the board: the top 1 percent lost 16.3 percent in real income from 2007 to 2009, the top 10 percent lost 11.3 percent, and the bottom 90 percent lost 13.7 percent. The equal opportunity recession, however, was succeeded by a startlingly unequal recovery. The top 1 percent saw their incomes grow by nearly a third from 2009 to 2012 — hoarding virtually all of the income gains of those years. The top 10 percent regained the ground they had lost during the recession. And the rest saw incomes fall another 1.8 percent. Some recovery.
Figure 4. Recovery Brings Income Benefits at the Top, Not the Bottom
Incomes in Iowa
At the state level, incomes (see map below) follow a familiar pattern: Since 2000, those states with incomes below (and sometimes substantially below) the national median have clustered in the Deep South and upper Midwest, those with higher incomes on the coasts and across the Sunbelt. The Rustbelt states, especially after 2007, tumble into the lower-income tier with each dip in the business cycle.
Figure 5. INTERACTIVE Troubling Trends in State Median Incomes, 2000-2012
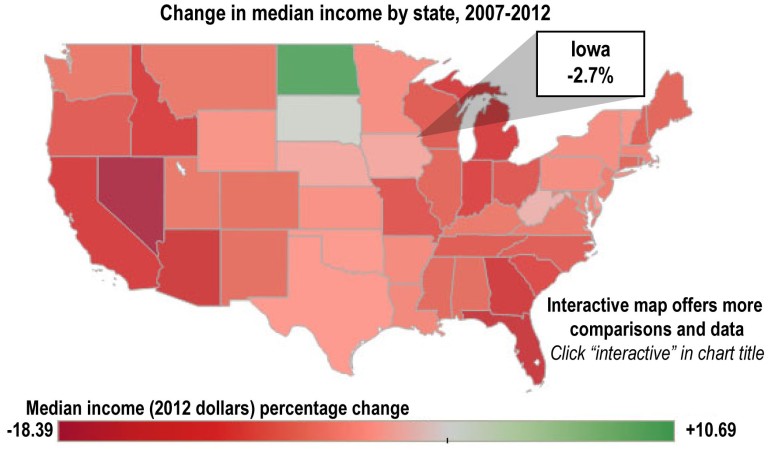
Source: Center on Budget and Policy Priorities analysis of American Community Survey
But more remarkable than the relative position of the rich states and poor states are the measures of change across the last 12 years. Between 2000 and 2012, real (inflation-adjusted) median income grew in only nine states. Indeed, often the only defense against stagnant or falling incomes across this span was the happy accident of a commodity or energy boom — which helped yielded modest income growth in states such as West Virginia, Louisiana, Montana, Wyoming, Iowa, Nebraska, Alaska and the Dakotas.
Between 2007 and 2012 (across the last recession and recovery), median income grew in only two states: North Dakota and South Dakota. In the latter, the growth was barely half a percentage point. Every other state saw median incomes fall, in 34 states by more than 5 percent, in eight states by more than 10 percent.
Even more troubling, the recovery phase of that business cycle (since 2009) has yielded real income gains in only five states: the Dakotas (again), West Virginia, Nebraska, and the District of Columbia. By contrast, 15 states saw median income fall more than 5 percent even as the national economy recovered.
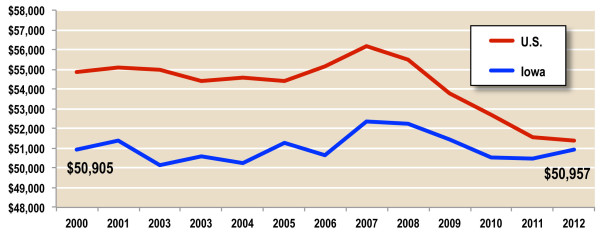
In Iowa (see Fig 6. below), median incomes show the same pattern: long-term stagnation, a slight rise in the years prior to the recession, a recessionary dip, and a painfully slow recovery. Median incomes in Iowa are lower than national median incomes, although that gap has narrowed because the recession was milder in Iowa: National median income fell 7.4 percent from 2007 to 2012; Iowa median income fell just 2.7 percent.
Figure 6. Median Income Declines for U.S., Stagnant in Iowa, 2000-2012
Poverty: The Big Picture
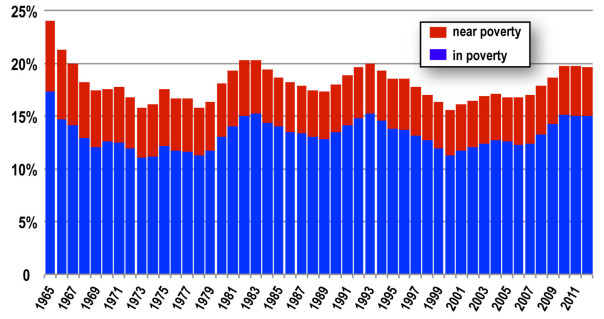
Nationally, the poverty rate declined steadily with the establishment and expansion of Social Security after 1935, the strength of unions and the broad sharing of postwar economic gains, and the antipoverty programs of the “Great Society” in the 1960s. The poverty rate fell to a postwar low of 11.1 percent in 1973 (see Figure 7 below), and has hovered in the 12 to 15 percent range ever since. Given the problematic nature of the official poverty measure (see sidebar), we get a better glimpse of the problem if we push the measure to 125 percent of the official rate. By this measure, the share of the poor and near-poor ranges between about 15 percent and 20 percent for the last four decades.
Put another way, we have made very little progress fighting poverty since the 1960s. While the boom of the late 1990s brought poverty rates close to their postwar lows, the last two recessions have ratcheted them up again. The 2007 recession pushed the share of poor and near-poor back near 20 percent (one in five Americans), and the recovery (since 2009) has done little to bring those numbers down.
Figure 7. Little Progress Fighting Poverty
Share of Americans In or Near Poverty Between 15-20 Percent Across Nearly Five Decades
Poverty in Iowa
In the states, poverty shows much the same regional variation as median incomes. Rates are highest in the Deep South and, more recently, in states (like Michigan) hit particularly hard by the recession. Virtually all states have seen an increase in their poverty rates over the last decade, since the onset of the recession in 2007, and since the start of the recovery in 2009.
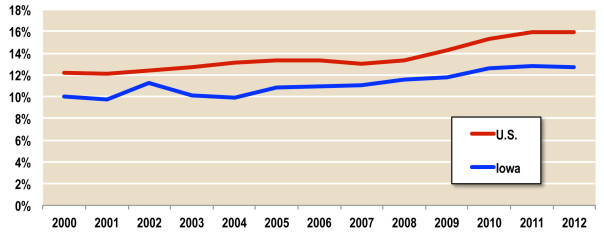
In Iowa, the poverty rate (Figure 9 below) runs a little below the national rate, and has increased slowly and steadily since 2004. We did not see the slight dip in poverty that occurred nationally with the pre-recession boom, and we did not see as dramatic a spike when the recession hit in 2007.
Figure 9. Poverty Rises Over Decade
Overall (individual) poverty rate, U.S. and Iowa, 2000-2012
Much the same pattern holds for the slightly higher (in the U.S. and in Iowa) child poverty rate. Nationally, one in five children live in poverty; in Iowa, it about one in six. Before the recession hit, the rate of child poverty was growing faster in Iowa than in the nation as a whole. This growth is especially apparent in Iowa’s urbanized areas, where child poverty has been growing at nearly twice the national rate.